今天想在Zend Framework框架中,使用Jpgraph第三库,查了许多资料,逛了许多论坛,发现在中文论坛中,关于这方面的资料很少,所以把自己摸索得到的经验,记录下来。希望能给需要这方面资料的朋友,提供一些参考。
1、Jpgraph库放在位置在library文件夹下,如下图所示:
2、在ElectorController.php控制器中,调用"showmsguiAction"方法如下:
/** * 转到显示投票结果界面 */ public function showmsguiAction(){ }3、显示投票结果的页面"showmsgui.html"如下:
<html><head><title>支持人数报表图</title><meta http-equiv="content-type" content="text/html;charset=utf-8"/></head><h1>显示支持两位总统的支持人数情况统计图</h1><table> <tr> <td><img src="/elector/showvote?id=1"/></td> <td><img src="/elector/showvote?id=2"/></td> </tr></table></html>
说明:其中关键之处在“electoral/showvote?id=1”和"elector/showvote?id=2",这里需要对zend framework的原理有一定了解,这里的意思是,图片的来源是来自ElectorController.php控制器中showvoteAction方法的调用。
4、ElectorController.php控制器中showvoteAction源代码如下:
/** * 调用Jpgraph接口,得到投票结果图表 */ public function showvoteAction(){ //在调用Jpgraph接口时,禁用layout和viewRenderer,否则会出问题 $this->_helper->getHelper ('layout')->disableLayout (); $this->_helper->getHelper ('viewRenderer')->setNoRender (); require_once ('../library/jpgraph/jpgraph.php'); require_once ('../library/jpgraph/jpgraph_bar.php'); $datay1=array(13,8,19,7,17,6); $datay2=array(0,0,0,0,0,0); // Create the graph. $graph = new Graph(350,250); $graph->SetScale('textlin'); $graph->SetMarginColor('silver'); // Setup title $id=$_REQUEST["id"]; if($id==1){ $title="Support Bushi Number"; }else if($id==2){ $title="Support AoBama Number"; } $graph->title->Set($title); $graph->title->SetFont(30,FS_BOLD); // Create the first bar $bplot = new BarPlot($datay1); $bplot->SetFillGradient('AntiqueWhite2','AntiqueWhite4:0.8',GRAD_VERT); $bplot->SetColor('darkred'); // Create the second bar $bplot2 = new BarPlot($datay2); $bplot2->SetFillGradient('olivedrab1','olivedrab4',GRAD_VERT); $bplot2->SetColor('darkgreen'); // And join them in an accumulated bar $accbplot = new AccBarPlot(array($bplot,$bplot2)); $graph->Add($accbplot); $graph->Stroke(); }5、得到的结果如下图所示:
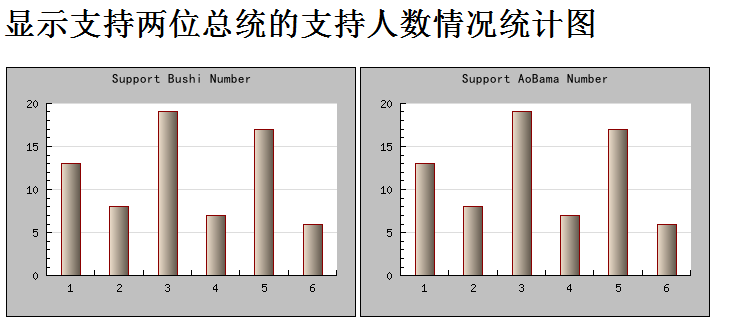
6、我认为其中关键的地方在第三步中,如何在zend framework框架中调用需要的方法,其他和平时编写的一样。