需求分析:NC文件的常规包netcdf4使用手感较xarray略显笨拙,故尝试使用xarray读取包含Group的.nc4文件
数据:S5P二级数据:S5P_RPRO_L2__HCHO, 来源:欧洲哥白尼,或NASA(推荐,因为好下载)
一、使用panoly可视化
(1)导入后的界面:
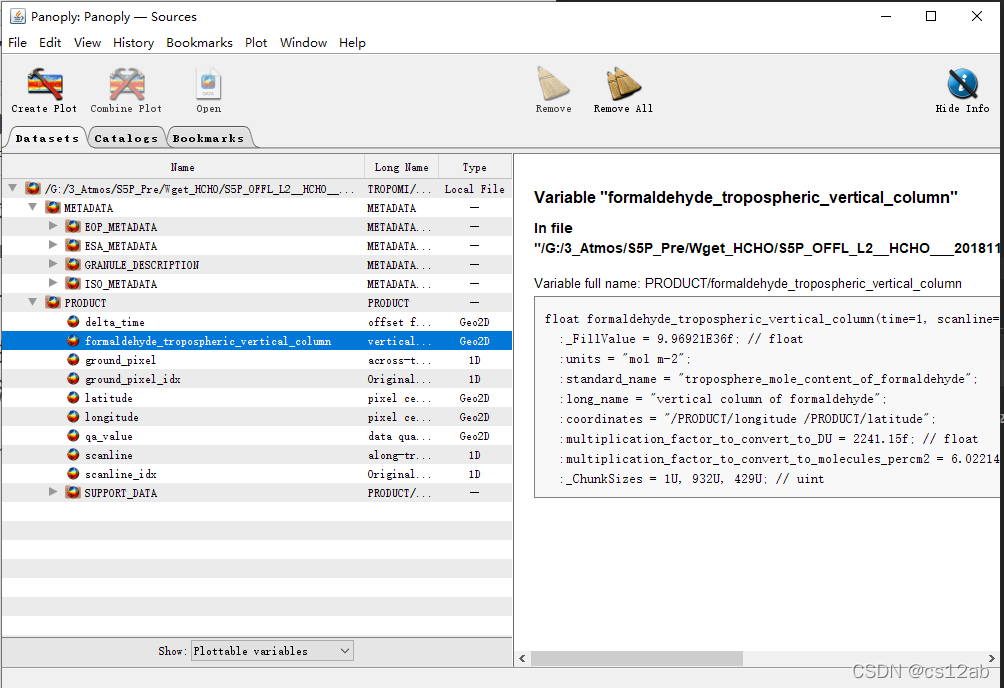
(2)选择变量后,点击Create Plot按钮可视化:
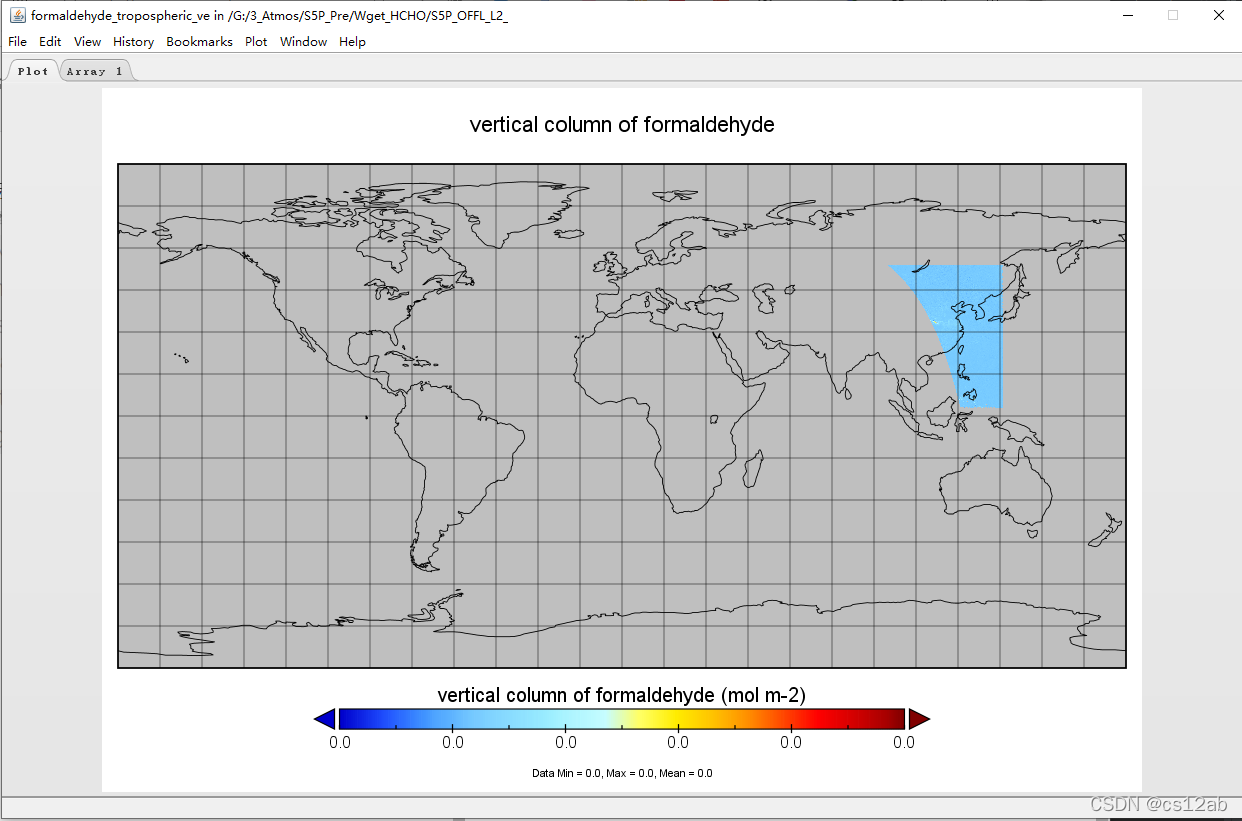
即可得到HCHO的Plot图以及Array可视化。
二、使用python里的工具包读取
import os
import xarray as xr
import netCDF4 as nc  # 对于nc4文件,其内含groups,Dir = ['../S5P_Pre/Wget_HCHO']   # 时间跨度180514 ~ 190805
file = os.listdir(Dir[0])
file.sort(key = lambda x:int(x.split('___')[1][:8]))  # 按年月日排序# (1)使用nc包打开
ns = nc.Dataset(os.path.join(Dir[0], file[0]))   #这里的数据存储在groups里面的PRODUCT里面
hcho = ns['PRODUCT']['formaldehyde_tropospheric_vertical_column'][:]# (2) 使用xarray包打开 —— 推荐方式
xs = xr.open_dataset(os.path.join(Dir[0], file[0]), group = 'PRODUCT')  # 这里需用group函数指定组名称
(1)netcdf4的读取结果:
In[29]: ns
Out[29]: Subset parameters: {
    "PRODUCT": ["S5P_L2__HCHO__.1"], "INFILENAMES": ["S5P_RPRO_L2__HCHO___20180514T023918_20180514T042246_03018_01_010105_20190203T205044.nc"], "INFILETYPE": ["nc"], "OUTFILETYPE": ["nc4"], "TIMENAME": [["TROP2010", "/PRODUCT/time", "/PRODUCT/delta_time"]], "VARNAMES": ["/PRODUCT/formaldehyde_tropospheric_vertical_column", "/PRODUCT/qa_value", "/PRODUCT/time_utc", "/PRODUCT/scanline", "/PRODUCT/ground_pixel"], "BOXLONRANGE": [73.0, 136.0], "BOXLATRANGE": [3.0, 54.0], "TIMERANGE": [800414432.0, 800496009.0], "GRIDTYPES": ["SWATH"], "CONVERTFILETYPE": [true]}dimensions(sizes): variables(dimensions): groups: PRODUCT, METADATAIn[30]: ns['PRODUCT']
Out[30]: <class 'netCDF4._netCDF4.Group'>
group /PRODUCT:dimensions(sizes): time(1), scanline(725), ground_pixel(237)variables(dimensions): uint16 time_idx(time), uint16 scanline_idx(scanline), uint16 ground_pixel_idx(ground_pixel), float32 longitude(time,scanline,ground_pixel), float32 latitude(time,scanline,ground_pixel), int32 time(time), int32 delta_time(time,scanline,ground_pixel), float32 formaldehyde_tropospheric_vertical_column(time,scanline,ground_pixel), uint8 qa_value(time,scanline,ground_pixel), <class 'str'> time_utc(time,scanline), int32 scanline(scanline), int32 ground_pixel(ground_pixel)groups: SUPPORT_DATAIn[31]: ns['PRODUCT'].variables.keys()
Out[31]: dict_keys(['time_idx', 'scanline_idx', 'ground_pixel_idx', 'longitude', 'latitude', 'time', 'delta_time', 'formaldehyde_tropospheric_vertical_column', 'qa_value', 'time_utc', 'scanline', 'ground_pixel'])
(2) xarray的读取结果:
xs
Out[34]:
<xarray.Dataset>
Dimensions:                                    (ground_pixel: 237, scanline: 725, time: 1)
Coordinates:* time                                       (time) datetime64[ns] 2018-05-14* scanline                                   (scanline) float64 1.507e+03 ....* ground_pixel                               (ground_pixel) float64 1.0 ......
Data variables:time_idx                                   (time) float32 0.0scanline_idx                               (scanline) float32 1.506e+03 ....ground_pixel_idx                           (ground_pixel) float32 0.0 ......longitude                                  (time, scanline, ground_pixel) float32 ...latitude                                   (time, scanline, ground_pixel) float32 ...delta_time                                 (time, scanline, ground_pixel) timedelta64[ns] ...formaldehyde_tropospheric_vertical_column  (time, scanline, ground_pixel) float32 ...qa_value                                   (time, scanline, ground_pixel) float32 ...time_utc                                   (time, scanline) object nan .....
三 、不足
使用xarray读取含Groups的嵌套文件如.nc4时,需要先知道其所在的Gropus名称,即需要先用panoly软件或nc4包打开。