Image Fusion with Guided Filtering
����Ŀ¼
- Image Fusion with Guided Filtering
-
-
- Two-scale Image Decomposition
- Weight Map Construction with Guided Filtering
- Two-scale Image Reconstruction
- Diagram of the proposed method
- Data
- Comparison with other image fusion methods
-
Two-scale Image Decomposition
�������ں�ͼ������In,n=1,2,....NI_{n},n=1,2,....NIn?,n=1,2,....N����ֵ�˲���ZZZ���˲��˳ߴ�Ϊ31��3131��3131��31��
Bn=In?ZDn=In?BnB_{n}=I_{n}*Z \\D_{n}=I_{n}-B_{n} Bn?=In??ZDn?=In??Bn?
����BnB_{n}Bn?Ϊ�����㣬DnD_{n}Dn?Ϊϸ�ڲ㡣
Weight Map Construction with Guided Filtering
��3��33��33��3��Laplacian����LLL�Ӵ��ں�ͼ�������л�ȡ��Ƶ��ϢHnH_{n}Hn?��
Hn=In?LH_{n}=I_{n}*L Hn?=In??L
Ϊȥ��������Ӱ�죬�Դ˸�Ƶ��Ϣ�ľ���ֵ��һ���ĵ�ͨ�˲������õ������������Saliency Map SnS_{n}Sn?��
Sn=�OHn�O?grg,��gS_{n}=|H_{n}|*g_{r_{g},\sigma{g}} Sn?=�OHn?�O?grg?,��g?
Saliency Map��ʾ��ͼ�������е�ͼ����������ϸ����Ϣ�������̶ȣ����ںϵĹ����У�����ϸ����Ϣ��Ϊ������ͼ������ߵ��ں�Ȩ�أ�ͨ���Ƚ�Saliency Map �õ�һ���������ں�Ȩ�أ�
Pnk={1if Snk=max?(S1k,S2k,��,SNk)0otherwise P_{n}^{k}=\left\{\begin{array}{cc} 1 & \text { if } S_{n}^{k}=\max \left(S_{1}^{k}, S_{2}^{k}, \ldots, S_{N}^{k}\right) \\ 0 & \text { otherwise } \end{array}\right. Pnk?={
10? if Snk?=max(S1k?,S2k?,��,SNk?) otherwise ?
��ȻPPP����ֱ�����ڶԴ��ں�ͼ�����е��ںϣ�����Ҫ���ǵ�ͼ���е���������Ե�ȣ���Ҫʹ��Guide Filter�Դ��ں�Ȩ�ؽ���ϸ�������£�
WnB=Gr1,?1(Pn,In)WnD=Gr2,?2(Pn,In)\begin{array}{l} W_{n}^{B}=G_{r_{1}, \epsilon_{1}}\left(P_{n}, I_{n}\right) \\ W_{n}^{D}=G_{r_{2}, \epsilon_{2}}\left(P_{n}, I_{n}\right) \end{array} WnB?=Gr1?,?1??(Pn?,In?)WnD?=Gr2?,?2??(Pn?,In?)?
����r��?r��\epsilonr��?�ֱ��ӦGuide Filter���˲��˰뾶��������������Ȩ����Ҫ��һ��
Two-scale Image Reconstruction
����ͼ���ںϵIJ��裬��Ҫ�ֱ������ϼ��������WnB��WnDW_{n}^{B}��W_{n}^{D}WnB?��WnD?�Ի������ϸ�ڲ���м�Ȩ��Ȼ���ںϹ���Ļ������ϸ�ڲ���������õ����յ��ںϽ����
B��=��n=1NWnBBnD��=��n=1NWnDDnF=B��+D��\begin{aligned} \bar{B} &=\sum_{n=1}^{N} W_{n}^{B} B_{n} \\ \bar{D} &=\sum_{n=1}^{N} W_{n}^{D} D_{n} \\ F&=\bar{B}+\bar{D} \end{aligned} B��D��F?=n=1��N?WnB?Bn?=n=1��N?WnD?Dn?=B��+D��?
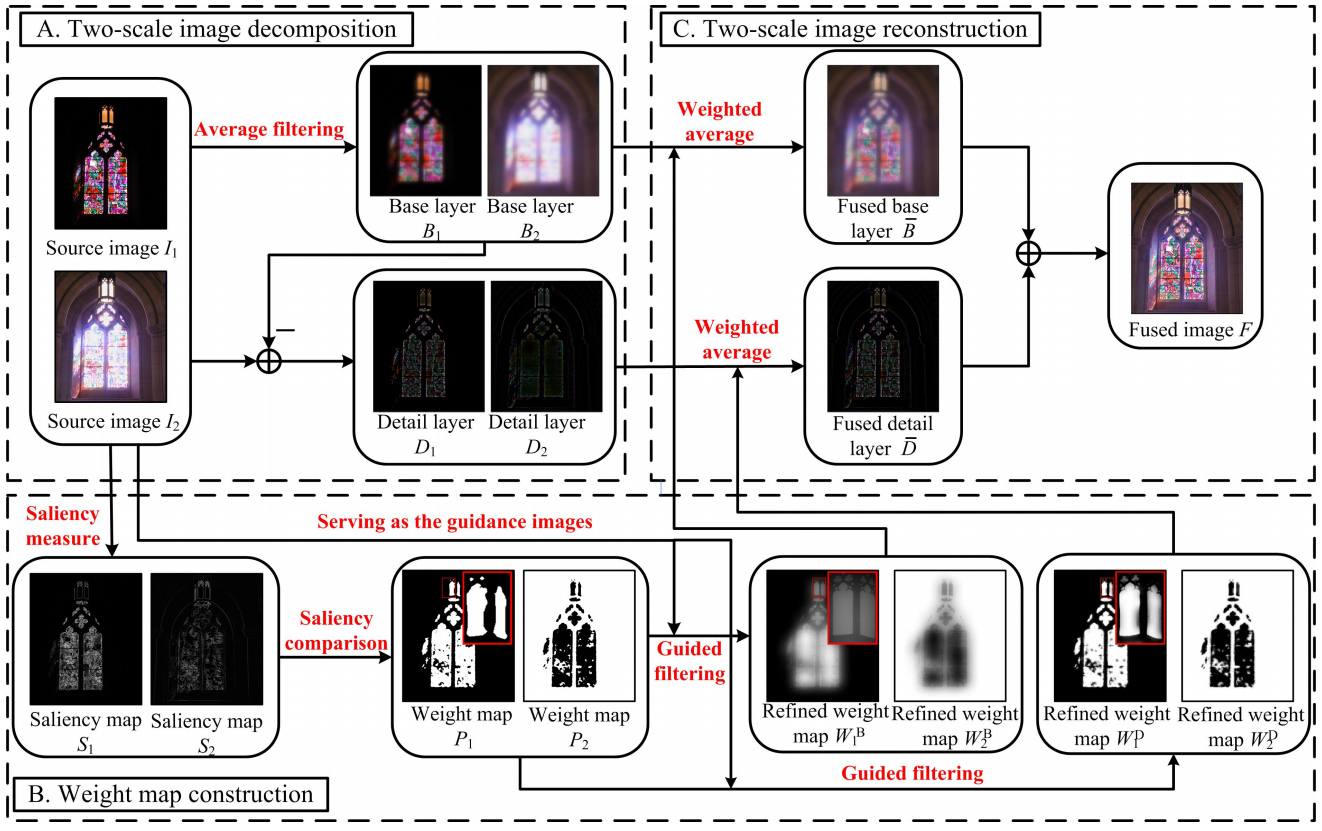
Diagram of the proposed method
��ͼΪ���������㷨������ͼ��������ͼ���Կ��������������㷨�Ƚ�ͼ��ֽ�Ϊ�������ϸ�ڲ㣬��Laplacian�㷨�ĵ�ͨ�������Ȩ��ͼ�������Ȩ��ͼ��ͼ�����н��м�Ȩ���õ����յ��ںϽ��
Data
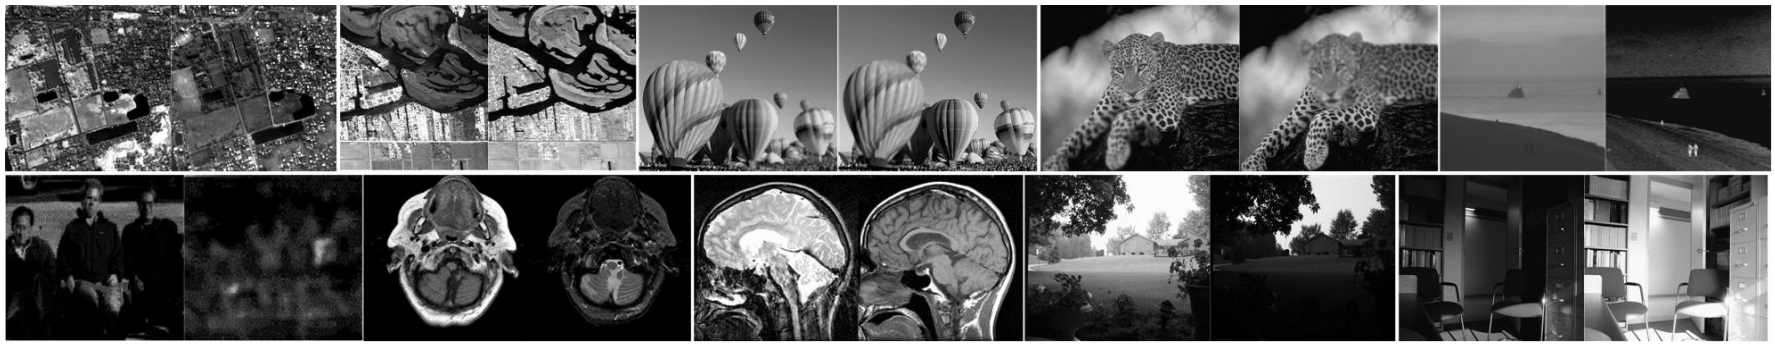
��ƪ���µ��㷨��֤�õ���Petrovic���ݿ��еĶ�������ݡ���Խ����ݡ����ع����ݣ���Ϊ��������
1.Normalized mutual information�����ڲ������ں�ͼ���е���Ϣ���ںϽ���еı����̶�
QMI=2[MI(A,F)H(A)+H(F)+MI(B,F)H(B)+H(F)]MI(A,F)=H(A)+H(F)?H(A,F)Q_{M I}=2\left[\frac{M I(A, F)}{H(A)+H(F)}+\frac{M I(B, F)}{H(B)+H(F)}\right]\\ M I(A, F)=H(A)+H(F)-H(A, F) QMI?=2[H(A)+H(F)MI(A,F)?+H(B)+H(F)MI(B,F)?]MI(A,F)=H(A)+H(F)?H(A,F)
����HHH�Ǽ����Ե��(Marginal Entropy)��H(A,F)H(A,F)H(A,F)�Ǽ��㽻����(Joint Entropy)��MIMIMI�Ǽ��㻥��Ϣ(Mutual Information)
2.Yang metric�����ڲ������ں�ͼ���еĽṹ��Ϣ���ںϽ���еı����̶�
QY={��wSSIM(Aw,Fw)+(1?��w)SSIM(Bw,Fw)if SSIM?(Aw,Bw�Ow)��0.75max?{SSIM?(Aw,Fw),SSIM?(Bw,Fw)}if SSIM?(Aw,Bw�Ow)<0.75Q_{Y}=\left\{\begin{array}{c} \lambda_{w} S S I M\left(A_{w}, F_{w}\right)+\left(1-\lambda_{w}\right) S S I M\left(B_{w}, F_{w}\right) \\ \text { if } \operatorname{SSIM}\left(A_{w}, B_{w} \mid w\right) \geq 0.75 \\ \max \left\{\operatorname{SSIM}\left(A_{w}, F_{w}\right), \operatorname{SSIM}\left(B_{w}, F_{w}\right)\right\} \\ \text { if } \operatorname{SSIM}\left(A_{w}, B_{w} \mid w\right)<0.75 \end{array}\right. QY?=????????��w?SSIM(Aw?,Fw?)+(1?��w?)SSIM(Bw?,Fw?) if SSIM(Aw?,Bw?�Ow)��0.75max{
SSIM(Aw?,Fw?),SSIM(Bw?,Fw?)} if SSIM(Aw?,Bw?�Ow)<0.75?
����www��7��77��77��7�Ĵ��ڣ���w=s(Aw)s(Aw)+s(Bw)\lambda_{w}=\frac{s\left(A_{w}\right)}{s\left(A_{w}\right)+s\left(B_{w}\right)}��w?=s(Aw?)+s(Bw?)s(Aw?)?��sss�Ǽ��㷽��
3.Cvejic matric�����ڲ������ں�ͼ���е���Ҫ��Ϣ���ںϽ���еı����̶�
QC=��(Aw,Bw,Fw)UIQI(Aw,Fw)+(1?��(Aw,Bw,Fw))UIQI(Bw,Fw)Q_{C}=\mu\left(A_{w}, B_{w}, F_{w}\right) U I Q I\left(A_{w}, F_{w}\right)+\left(1-\mu\left(A_{w}, B_{w}, F_{w}\right)\right) U I Q I\left(B_{w}, F_{w}\right) QC?=��(Aw?,Bw?,Fw?)UIQI(Aw?,Fw?)+(1?��(Aw?,Bw?,Fw?))UIQI(Bw?,Fw?)
��(Aw,Bw,Fw)={0,if ��AF��AF+��BF<0��AF��AF+��BF,if 0�ܦ�AF��AF+��BF<11,if ��AF��AF+��BF>1\mu\left(A_{w}, B_{w}, F_{w}\right)=\left\{\begin{array}{cc} 0, & \text { if } \frac{\sigma_{A F}}{\sigma_{A F}+\sigma_{B F}}<0 \\ \frac{\sigma_{A F}}{\sigma_{A F}+\sigma_{B F}}, & \text { if } 0 \leq \frac{\sigma_{A F}}{\sigma_{A F}+\sigma_{B F}}<1 \\ 1, & \text { if } \frac{\sigma_{A F}}{\sigma_{A F}+\sigma_{B F}}>1 \end{array}\right. ��(Aw?,Bw?,Fw?)=????0,��AF?+��BF?��AF??,1,? if ��AF?+��BF?��AF??<0 if 0����AF?+��BF?��AF??<1 if ��AF?+��BF?��AF??>1?
������\sigma����ʾЭ���UIQIUIQIUIQI�����ԡ�A universal image quality index����ͼ������ָ��
4.Gradient based index�����ڲ������ں�ͼ���еı�Ե��Ϣ���ںϽ���еı����̶�
QG=��i=1N��j=1M(QAF(i,j)��A(i,j)+QBF(i,j)��B(i,j))��i=1N��j=1M(��A(i,j)+��B(i,j))Q_{G}=\frac{\sum_{i=1}^{N} \sum_{j=1}^{M}\left(Q^{A F}(i, j) \tau^{A}(i, j)+Q^{B F}(i, j) \tau^{B}(i, j)\right)}{\sum_{i=1}^{N} \sum_{j=1}^{M}\left(\tau^{A}(i, j)+\tau^{B}(i, j)\right)} QG?=��i=1N?��j=1M?(��A(i,j)+��B(i,j))��i=1N?��j=1M?(QAF(i,j)��A(i,j)+QBF(i,j)��B(i,j))?
QAF=QgAFQoAF;QBF=QgBFQoBFQ^{A F}=Q_{g}^{A F} Q_{o}^{A F};Q^{B F}=Q_{g}^{B F} Q_{o}^{B F} QAF=QgAF?QoAF?;QBF=QgBF?QoBF?
����QgQ_{g}Qg?��ʾ�ںϽ����ԭͼ��Եǿ�ȵı����̶ȣ�QoQ_{o}Qo?��ʾ�ںϽ����ԭͼ��Ե����ı����̶ȣ��Ӧ���Ϊ�趨��Ȩ��
5.Phase congruency based index�����ڲ������ں�ͼ���е�������Ϣ���ںϽ���еı����̶�
QP=(Pp)��(PM)��(Pm)��Q_{P}=\left(P_{p}\right)^{\alpha}\left(P_{M}\right)^{\beta}\left(P_{m}\right)^{\gamma} QP?=(Pp?)��(PM?)��(Pm?)��
����p��M��mp��M��mp��M��m�ֱ��ʾ��λһ���ԡ��ص����ֵ���ص���Сֵ�������¡���\alpha��\beta��\gamma����������һ������Ϊ1
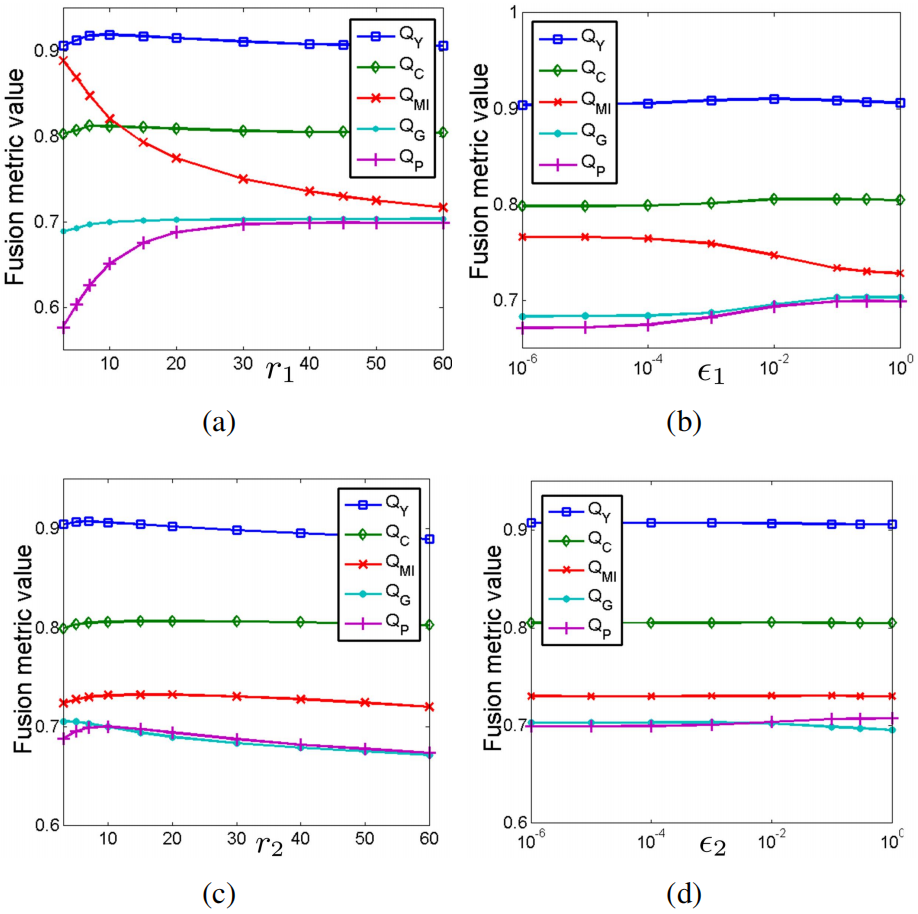
��ͼ�DZ��������㷨������5��ָ��ľ�����֣�����rrrΪguide filter���˲����ڳߴ磬$\epsilon $Ϊ������
Comparison with other image fusion methods
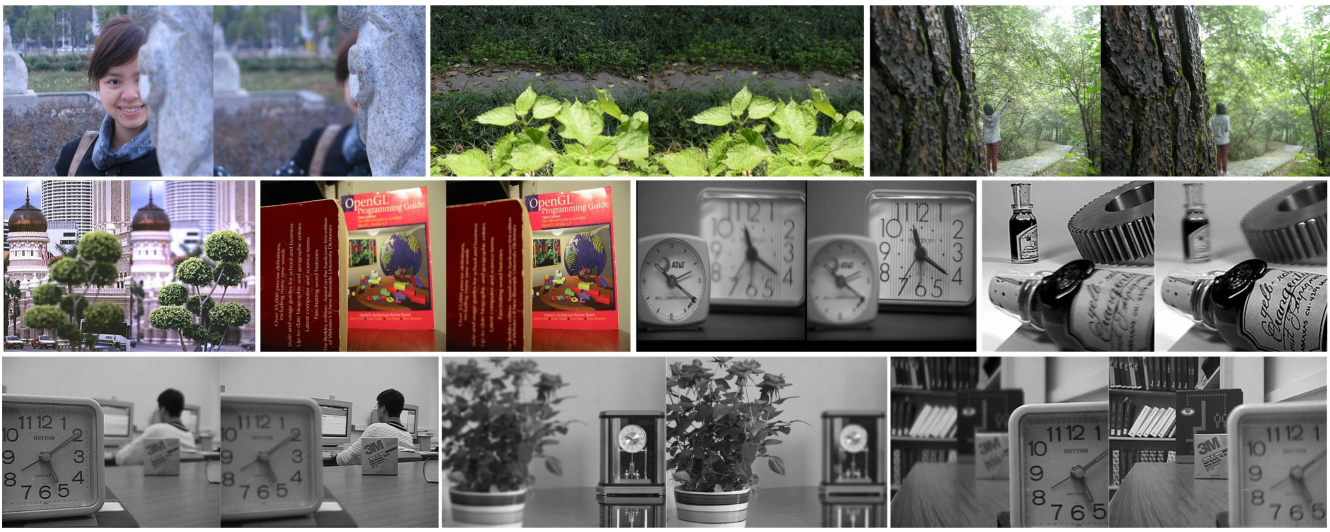
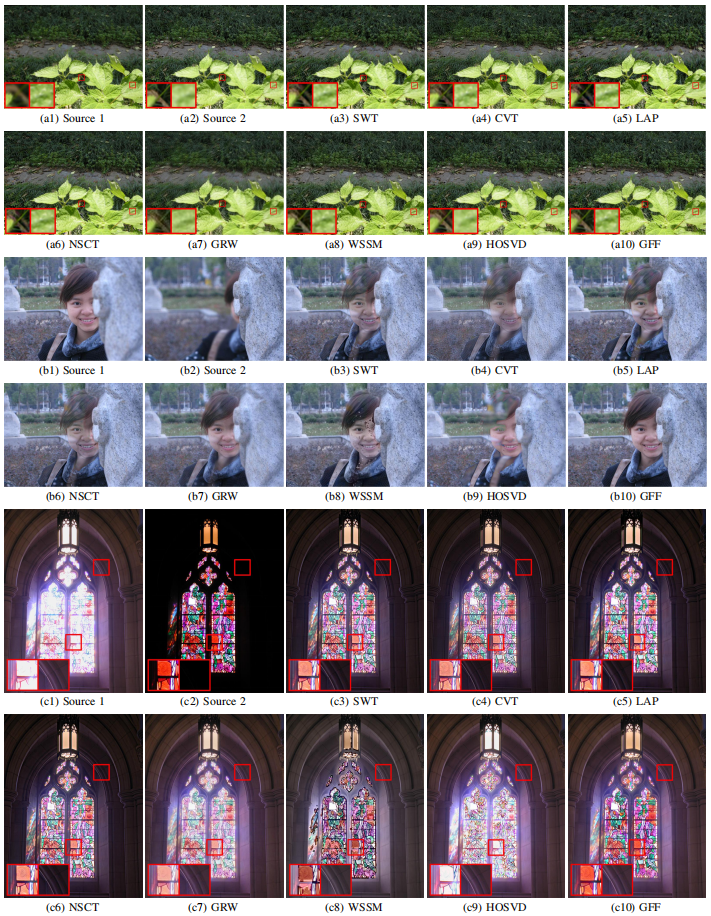
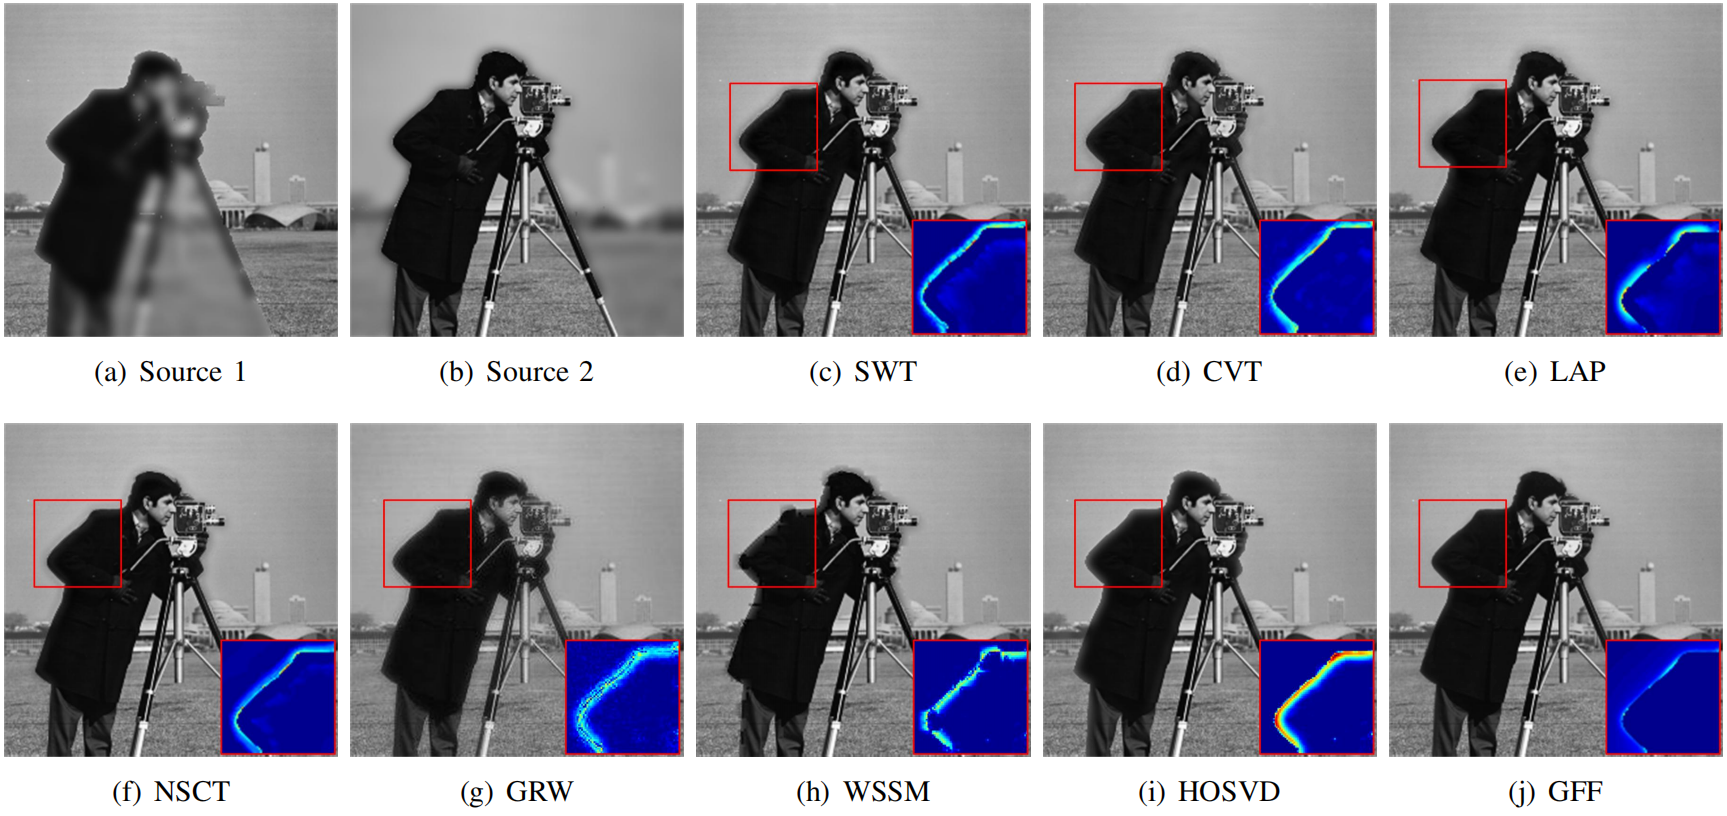
��ͼ�ֱ��DZ��������㷨�������㷨�ںϻҶ�ͼ��ɫͼ��Ч���Ƚ�ʾ��ͼ�����������㷨��ϸ�ڱ��������ϸ߲�����αӰ�����ܹ���һ���̶��ϱ��������Ӱ
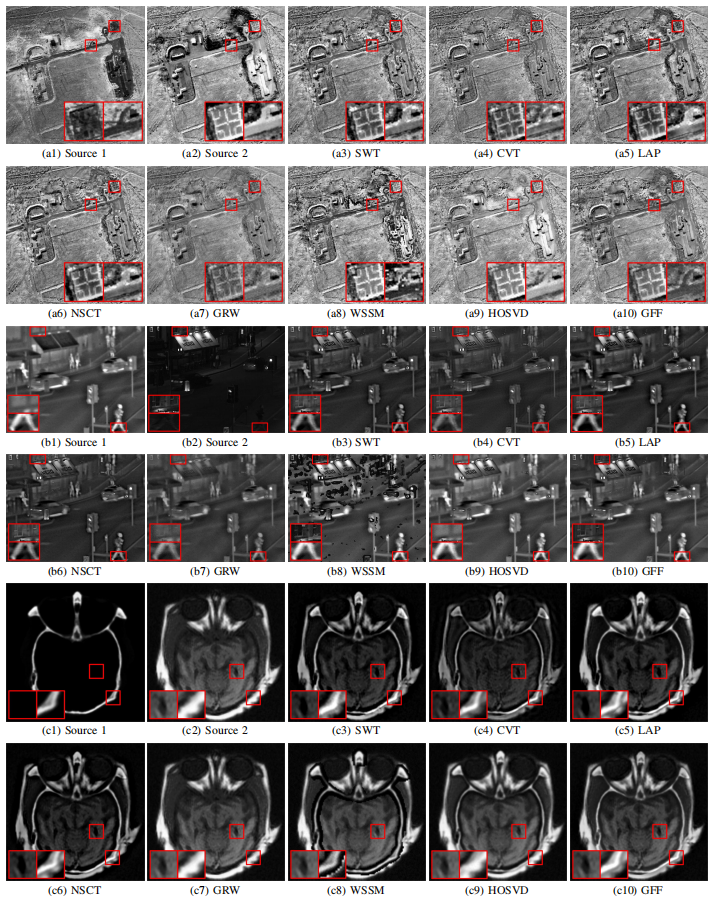
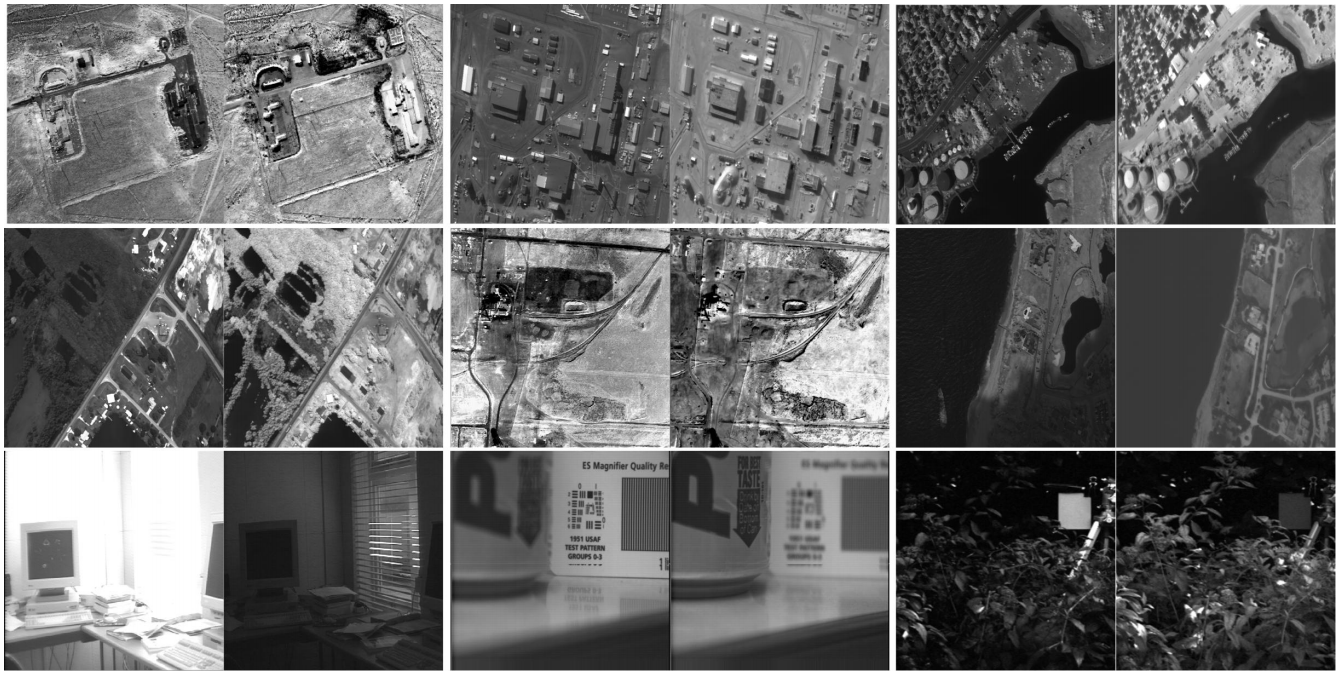
��ͼ�DZ��������㷨�������㷨�ں϶�Խ�ͼ���Ч���Ա�ʾ��ͼ�����������㷨������Halo��Խ���
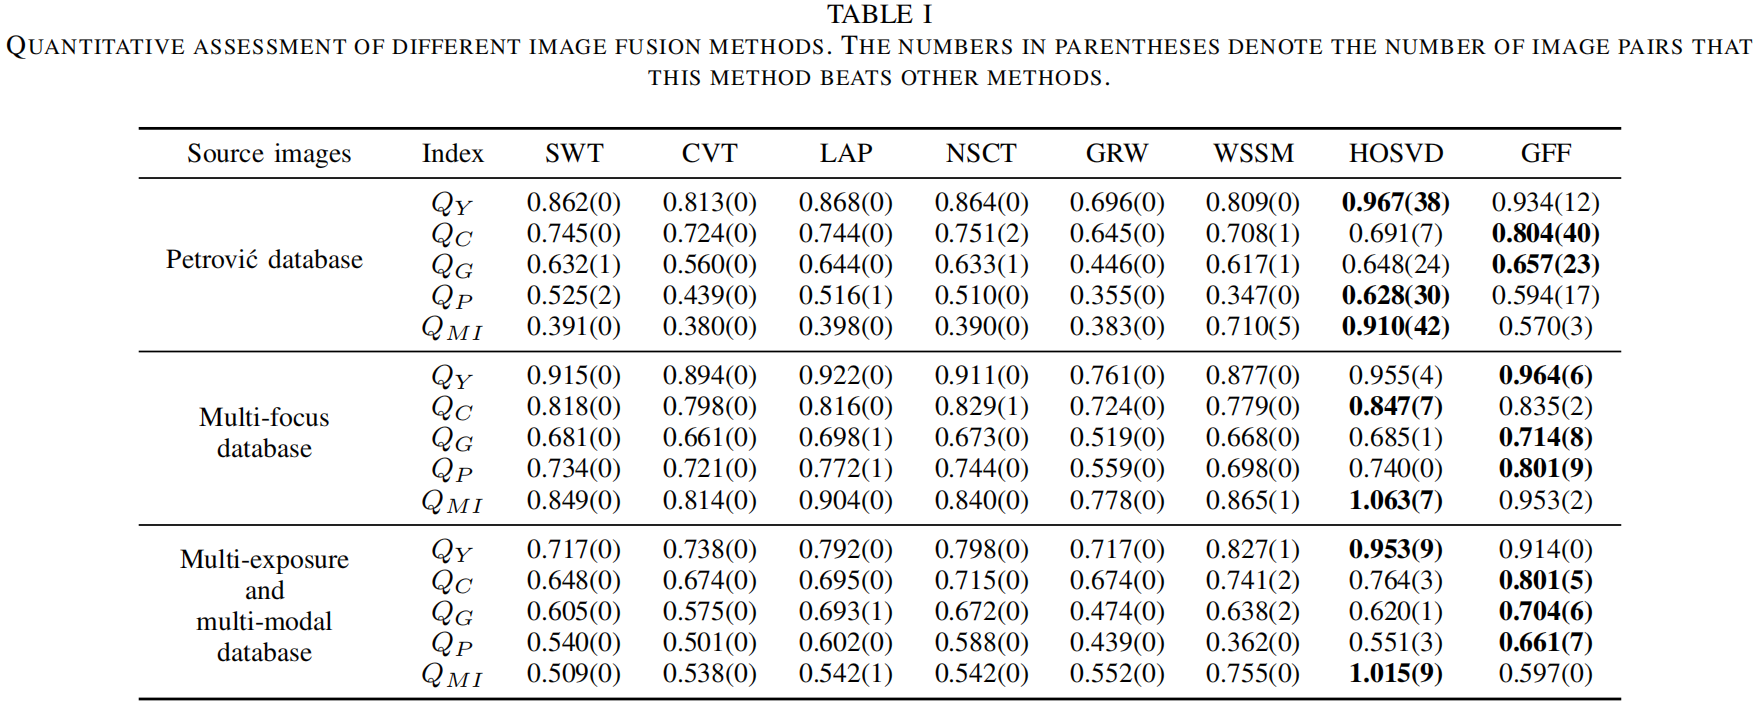
�±�����������ͼ���ںϽ����������5����ָ���������㷨�ıȽϣ��ۺϿ��������������㷨������ָ���ϱ��ֽϺ�
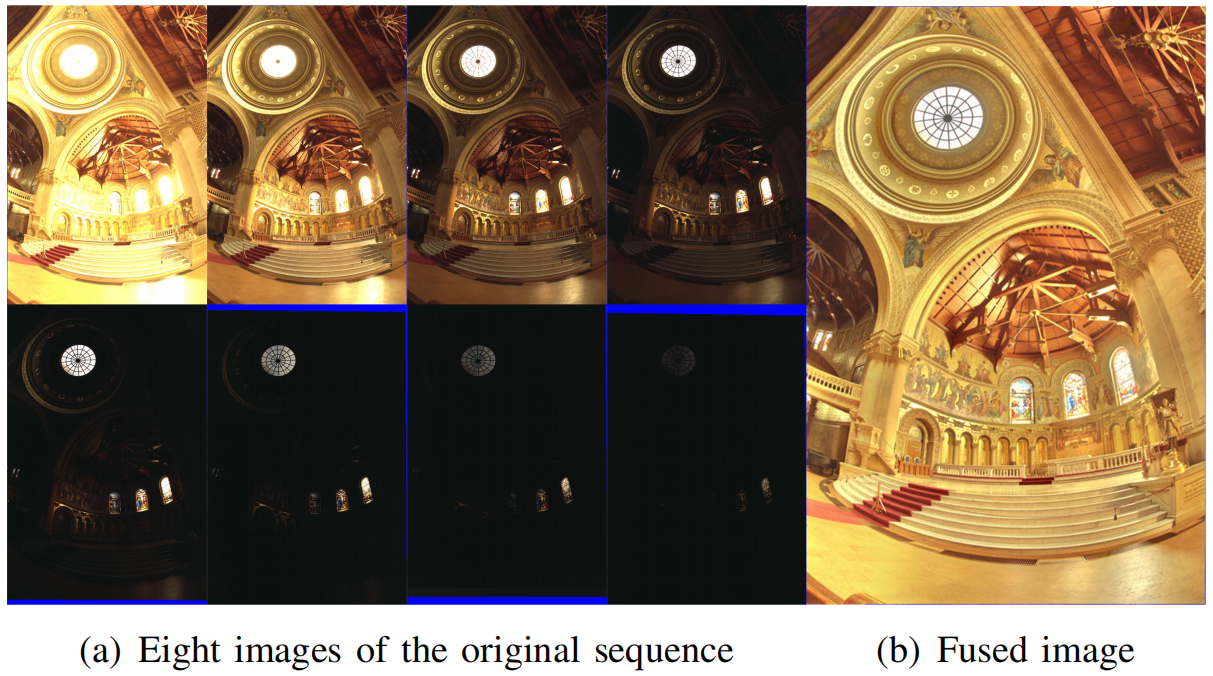
ǰ����֤�Ĵ��ں�ͼ�������ж�������֡���ں�ͼ����ͼ��8֡���ں�����ʹ�ñ��ķ������ںϽ��