ArcGIS API for Silverlight 中提供的内置专题渲染类型包括简单符号化、唯一值符号化和分级符号化,如果想要实现其他的专题类型,如饼图、柱状图、仪表盘等,则需要
通过自定义开发的方式进行扩展。
自定义专题图类型的基本思路是使用ElementLayer与图表控件(如开源的 Visifire)相结合,在 ElementLayer 的 Children集合中添加图表对象(UI元素)。
实现一个专题图类型的基本思路:
1) 获取专题数据(例如通过 QueryTask从服务器获取) ;
2) 计算要素的标注点(GeometryService 的 LablePoints 方法) ;
3) 根据专题数据生成图表(调用图表控件) ;
4) 将图表添加到 ElementLayer 中(计算图表的大小、位置) 。
下面将通过示例展示如何创建自定义专题图。核心代码
处理专题数据查询结果 void queryTask_ExecuteCompleted(object sender, QueryEventArgs e){ // 遍历查询结果(待绘制的专题数据) foreach (Graphic feature in e.FeatureSet.Features) { // 计算要素的标注点 GeometryService gpLabelPoints=newGeometryService(_geoServiceUrl); IList<Graphic> lstGraphics= new List<Graphic>(); lstGraphics.Add(feature); gpLabelPoints.LabelPointsAsync(lstGraphics); // 记录要素的属性(计算标注点后将失去属性) IDictionary<string, double> dicGraphicAttr = newDictionary<string, double>(); foreach (KeyValuePair<string, object> item in feature.Attributes) { //不包含比例字段 if (!_isIncludeScaleField && _scaleField != "") { if(_scaleField.ToLower() == item.Key.ToLower()) continue; } string value = item.Value.ToString(); double dValue; if (double.TryParse(value, outdValue)) { dicGraphicAttr.Add(item.Key,dValue); } } // 计算图表的半径 double dRadius = _radius; if (_isUseChartScale == true) { if (_scaleField != "" && feature.Attributes.ContainsKey(_scaleField)) { object oValue =feature.Attributes[_scaleField]; if (oValue != null) { double dScaleValue =Convert.ToDouble(oValue); dRadius = CalcRadius(dScaleValue); } } } //通过Lamda表达式实现对属性的访问(LabelPoint得到的Graphics没有属性) gpLabelPoints.LabelPointsCompleted += (object sender2, GraphicsEventArgsargs) => { // 获取要素标注点 MapPoint mapPoint = args.Results[0].Geometry as MapPoint; // 计算图表的外包矩形 Envelope extent = newEnvelope(mapPoint.X - dRadius, mapPoint.Y - dRadius, mapPoint.X + dRadius,mapPoint.Y + dRadius); // 创建图表 Chart chart = newChart(); chart.View3D =_isView3D; DataSeries dataSeries = new DataSeries(); dataSeries.RenderAs =_chartType; // 图表类型(饼图、柱状图等) dataSeries.LabelEnabled = false; dataSeries.LabelLineEnabled =false; // 添加图表数据(如饼图的饼块、柱状图的柱条等) foreach(KeyValuePair<string, double> dataItem in dicGraphicAttr) { DataPoint dataPoint = newDataPoint(); dataPoint.AxisXLabel = dataItem.Key; dataPoint.YValue =dataItem.Value; dataSeries.DataPoints.Add(dataPoint); } chart.Series.Add(dataSeries); // 设置其他属性 chart.Background= null; chart.BorderBrush =null; chart.IndicatorEnabled= false; chart.LightingEnabled = false; ElementLayer.SetEnvelope(chart, extent);// 指定图表的外包矩形 // 将图表添加到ElementLayer中 _themeLayer.Children.Add(chart); }; } }下面是效果图
注:本例是使用的全国各省市的GDP产业数据以及能耗数据。
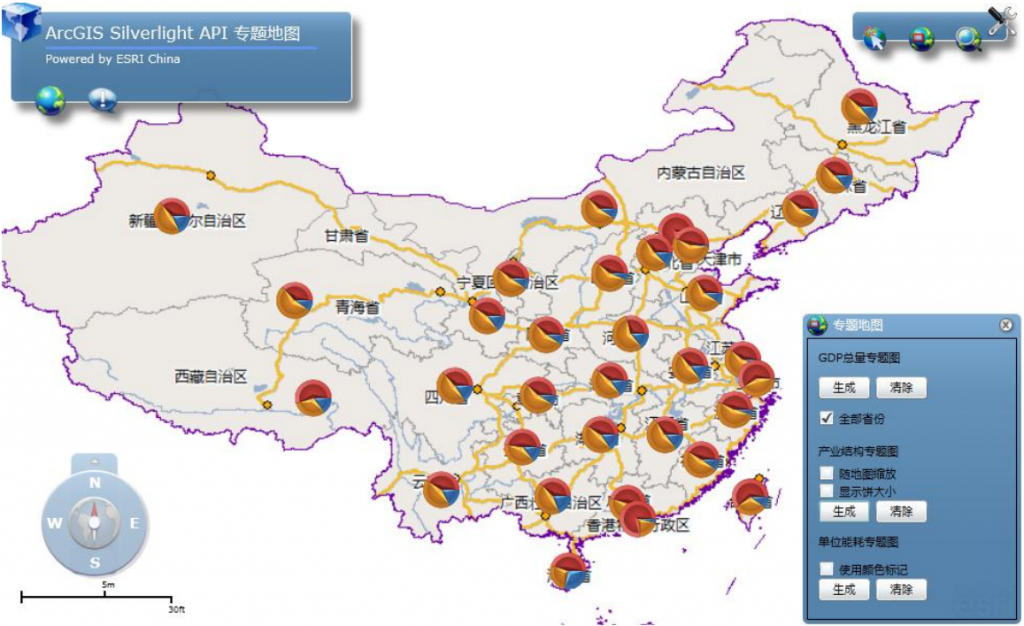
饼的大小一样(GDP产业结构)
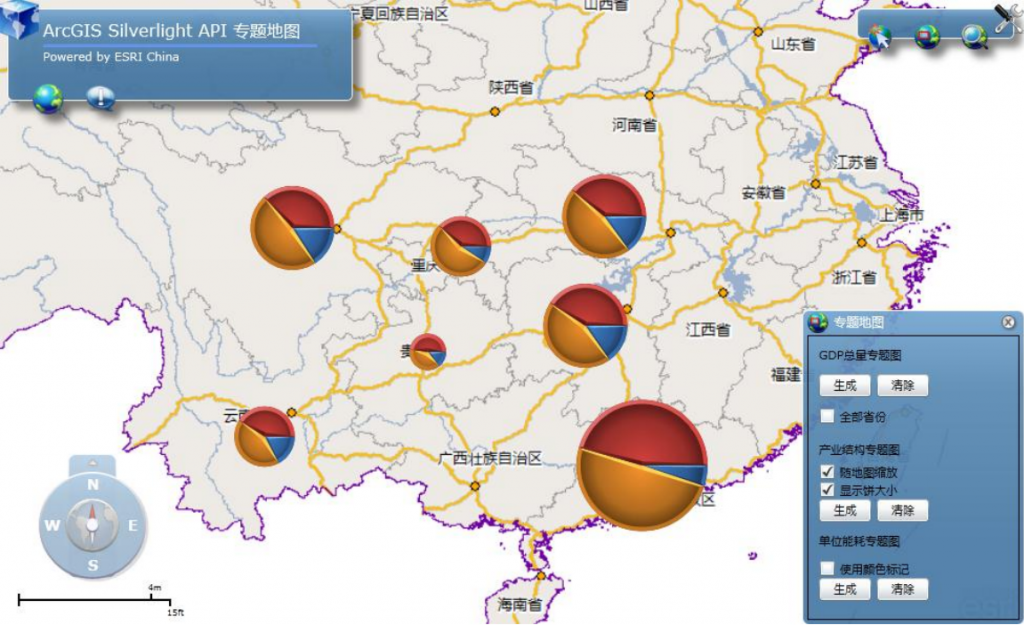
饼的大小分级(大小表示GDP总量)
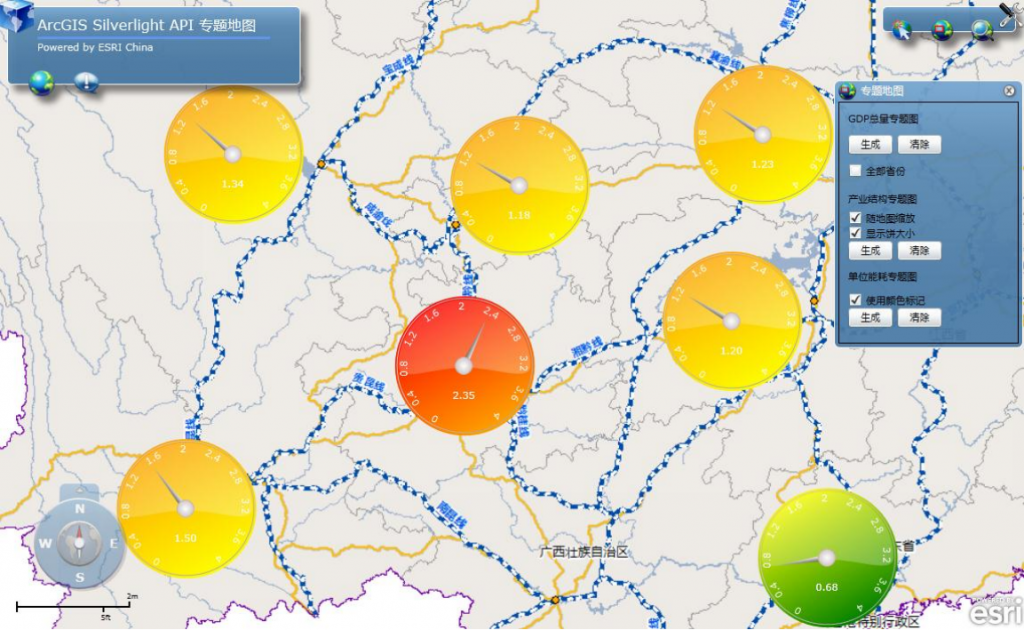
仪表盘专题(单位GDP能耗)
篇幅所限,只贴了核心代码,如需完整代码,请在评论住留下邮箱地址。
欢迎加入ArcGIS Silverlight API讨论群交流:147535735