怎么在Reporting Service2008 R2中,制作既包含柱状图和折线图的混合图表?
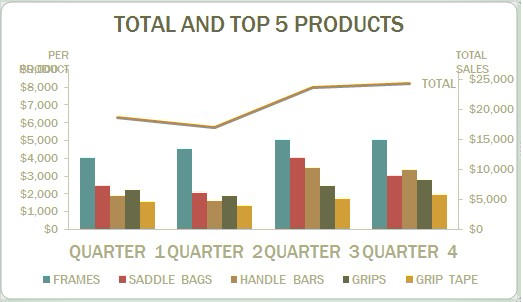
形如附件。要求显示两个数值,最好有不同的y轴。在msdn上查到Reporting Service 2005可以很方便的在柱状图中添加折线(http://msdn.microsoft.com/zh-cn/library/aa964128%28v=sql.90%29.aspx),不知道Reporting Service 2008 R2中怎么实现?请专家们帮帮忙!
------解决方案--------------------
恭喜。

------解决方案--------------------
