一、官网
英文官网:Leaflet
中文官网:Leaflet
二、介绍
Leaflet 是一个开源并且对移动端友好的交互式地图 JavaScript 库。 它大小仅仅只有39 KB, 并且拥有绝大部分开发者所需要的所有地图特性。
Leaflet 简单、高效并且易用。 它可以高效的运行在桌面和移动平台, 拥有着大量的扩展插件、 优秀的文档、简单易用的API 和完善的案例, 以及可读性较好的 源码 。
三、下载Leaflet
【1】CDN
// html头部引入
<link rel="stylesheet" href="https://unpkg.com/leaflet@1.7.1/dist/leaflet.css" />
<script src="https://unpkg.com/leaflet@1.7.1/dist/leaflet.js"></script>// 为避免潜在的安全问题,建议在使用CDN中的Leaflet时启用subresource integrity<link rel="stylesheet" href="https://unpkg.com/leaflet@1.7.1/dist/leaflet.css" integrity="sha512-xodZBNTC5n17Xt2atTPuE1HxjVMSvLVW9ocqUKLsCC5CXdbqCmblAshOMAS6/keqq/sMZMZ19scR4PsZChSR7A==" crossorigin="" /><script src="https://unpkg.com/leaflet@1.7.1/dist/leaflet.js"  integrity="sha512-XQoYMqMTK8LvdxXYG3nZ448hOEQiglfqkJs1NOQV44cWnUrBc8PkAOcXy20w0vlaXaVUearIOBhiXZ5V3ynxwA==" crossorigin=""></script>
【2】下载到本地
| 版本 | 说明 |
|---|---|
| Leaflet 1.7.1 | 稳定版,于2020年9月3日发布。 |
| Leaflet 1.8-dev | 开发版,在master分支上开发。 |
| Leaflet 0.7.7 | 旧版,于2013年11月18日发布,最新更新于2015年10月26日。 |
在从上述链接下载文件到本地,将下载的文件解压到项目目录中,并将其添加到HTML代码的开头
<link rel="stylesheet" href="/leftlet/leaflet.css" />
<script src="/leftlet/leaflet.js"></script>
【3】npm
npm install leaflet四、简单入门教程(开始使用leafLet)
【1】案例
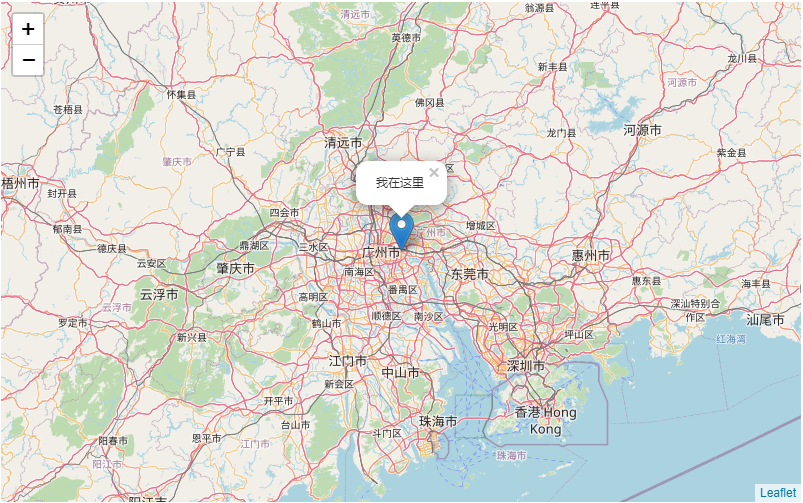
在 id 为map的 div 中创建一个地图, 选择瓦片数据源, 添加一个标记点并且在弹出层上显示文本
<!DOCTYPE html>
<html>
<head><meta http-equiv="Content-Type" content="text/html; charset=utf-8" /><title></title><!--leaflet样式文件--><link rel="stylesheet" href="https://unpkg.com/leaflet@1.7.1/dist/leaflet.css" /><!--leaflet核心JS文件--><script src="https://unpkg.com/leaflet@1.7.1/dist/leaflet.js"></script><style>/*必须指定宽高度*/#map {width: 800px;height: 500px;}</style>
</head><body><div id="map"></div><script>// 创建一个地图var map = L.map("map", {center: [23.127013, 113.366266],zoom: 8});// 选择瓦片数据源L.tileLayer('https://{s}.tile.openstreetmap.org/{z}/{x}/{y}.png').addTo(map);// 添加一个标记点并且在弹出层上显示文本L.marker([23.127013, 113.366266]).addTo(map).bindPopup('我在这里').openPopup();</script></body>
</html>
【2】效果
五、瓦片地图介绍
其实瓦片地图并不是什么特殊的文件,就是最普通的png图片。之所以为地图,就是带有了地理坐标。打开network,查看其请求的的url就能明白其请求的原理了。我们上面看到的地图是由一张张带有地理坐标的图片拼接起来的
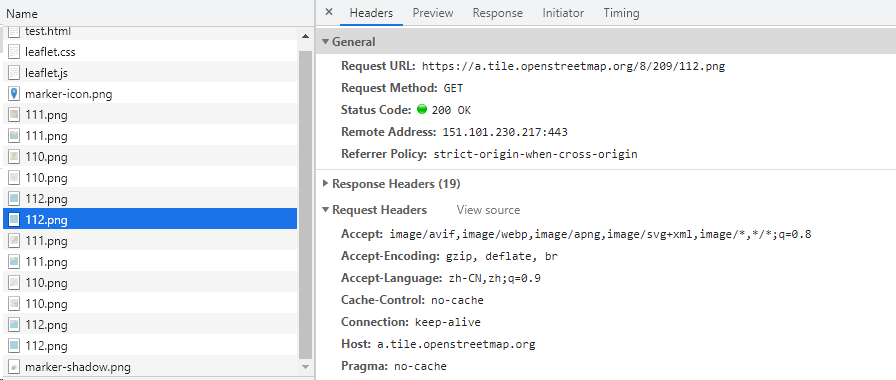
首先我们要明白瓦片地图的请求原理。上面其中一个图片的URL为:https://a.tile.openstreetmap.org/8/209/112.png
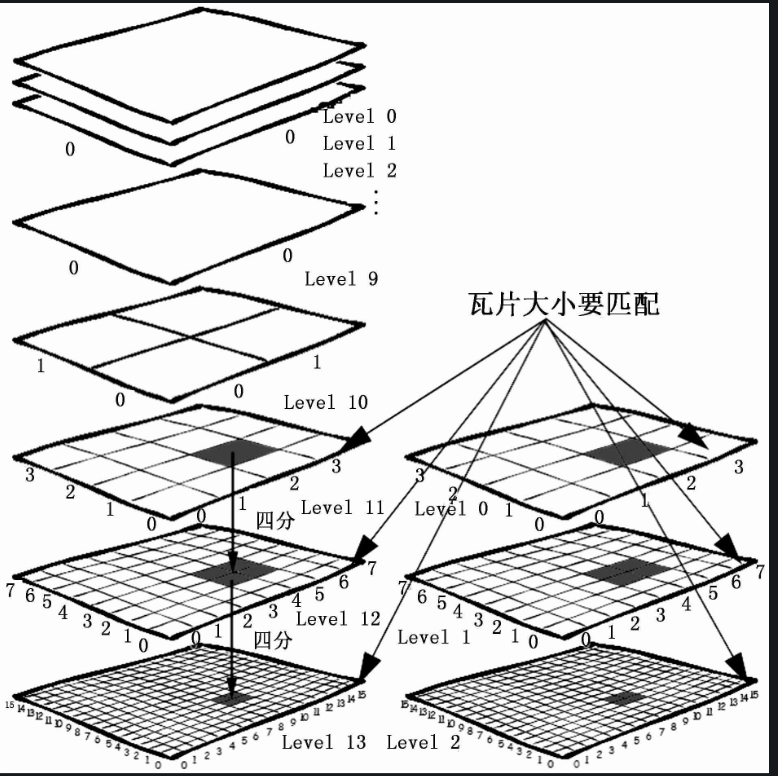
主要在于最后三位,含义依次是8级的209行、112列(或者209列、112行)。8就是下图中的level(地图放大缩小层级),而行列号对应每一级level里面的唯一一个瓦片(图片),那么地图框架为我们完成的就是,在对应地图层级,请求对应范围内的瓦片,而这个协议规则一般是通用的谷歌标准(也有其他标准,看框架是否支持),比如第9级中的第一个不会叫9-0-0,而可能是9-1-1(真实可能不是)
六、 Leaflet加载各种地图
Leaflet调用各种地图的功能十分复杂,幸好有leaflet.ChineseTmsProviders 这个插件,此插件源代码如下,你可以直接复制下面代码创建为js文件(可命名为leaflet.ChineseTmsProviders.js),然后引入你的HTML页面便可使用
// this L.CRS.Baidu from https://github.com/muyao1987/leaflet-tileLayer-baidugaode/blob/master/src/tileLayer.baidu.jsif (L.Proj) {L.CRS.Baidu = new L.Proj.CRS('EPSG:900913', '+proj=merc +a=6378206 +b=6356584.314245179 +lat_ts=0.0 +lon_0=0.0 +x_0=0 +y_0=0 +k=1.0 +units=m +nadgrids=@null +wktext  +no_defs', {resolutions: function () {var level = 19var res = [];res[0] = Math.pow(2, 18);for (var i = 1; i < level; i++) {res[i] = Math.pow(2, (18 - i))}return res;}(),origin: [0, 0],bounds: L.bounds([20037508.342789244, 0], [0, 20037508.342789244])});
}L.TileLayer.ChinaProvider = L.TileLayer.extend({initialize: function(type, options) { // (type, Object)var providers = L.TileLayer.ChinaProvider.providers;options = options || {}var parts = type.split('.');var providerName = parts[0];var mapName = parts[1];var mapType = parts[2];var url = providers[providerName][mapName][mapType];options.subdomains = providers[providerName].Subdomains;options.key = options.key || providers[providerName].key;if ('tms' in providers[providerName]) {options.tms = providers[providerName]['tms']}L.TileLayer.prototype.initialize.call(this, url, options);}
});L.TileLayer.ChinaProvider.providers = {TianDiTu: {Normal: {Map: "http://t{s}.tianditu.gov.cn/DataServer?T=vec_w&X={x}&Y={y}&L={z}&tk={key}",Annotion: "http://t{s}.tianditu.gov.cn/DataServer?T=cva_w&X={x}&Y={y}&L={z}&tk={key}"},Satellite: {Map: "http://t{s}.tianditu.gov.cn/DataServer?T=img_w&X={x}&Y={y}&L={z}&tk={key}",Annotion: "http://t{s}.tianditu.gov.cn/DataServer?T=cia_w&X={x}&Y={y}&L={z}&tk={key}"},Terrain: {Map: "http://t{s}.tianditu.gov.cn/DataServer?T=ter_w&X={x}&Y={y}&L={z}&tk={key}",Annotion: "http://t{s}.tianditu.gov.cn/DataServer?T=cta_w&X={x}&Y={y}&L={z}&tk={key}"},Subdomains: ['0', '1', '2', '3', '4', '5', '6', '7'],key: "174705aebfe31b79b3587279e211cb9a"},GaoDe: {Normal: {Map: 'http://webrd0{s}.is.autonavi.com/appmaptile?lang=zh_cn&size=1&scale=1&style=8&x={x}&y={y}&z={z}'},Satellite: {Map: 'http://webst0{s}.is.autonavi.com/appmaptile?style=6&x={x}&y={y}&z={z}',Annotion: 'http://webst0{s}.is.autonavi.com/appmaptile?style=8&x={x}&y={y}&z={z}'},Subdomains: ["1", "2", "3", "4"]},Google: {Normal: {Map: "http://www.google.cn/maps/vt?lyrs=m@189&gl=cn&x={x}&y={y}&z={z}"},Satellite: {Map: "http://www.google.cn/maps/vt?lyrs=s@189&gl=cn&x={x}&y={y}&z={z}",Annotion: "http://www.google.cn/maps/vt?lyrs=y@189&gl=cn&x={x}&y={y}&z={z}"},Subdomains: []},Geoq: {Normal: {Map: "http://map.geoq.cn/ArcGIS/rest/services/ChinaOnlineCommunity/MapServer/tile/{z}/{y}/{x}",PurplishBlue: "http://map.geoq.cn/ArcGIS/rest/services/ChinaOnlineStreetPurplishBlue/MapServer/tile/{z}/{y}/{x}",Gray: "http://map.geoq.cn/ArcGIS/rest/services/ChinaOnlineStreetGray/MapServer/tile/{z}/{y}/{x}",Warm: "http://map.geoq.cn/ArcGIS/rest/services/ChinaOnlineStreetWarm/MapServer/tile/{z}/{y}/{x}",},Theme: {Hydro: "http://thematic.geoq.cn/arcgis/rest/services/ThematicMaps/WorldHydroMap/MapServer/tile/{z}/{y}/{x}"},Subdomains: []},OSM: {Normal: {Map: "http://{s}.tile.osm.org/{z}/{x}/{y}.png",},Subdomains: ['a', 'b', 'c']},Baidu: {Normal: {Map: 'http://online{s}.map.bdimg.com/onlinelabel/?qt=tile&x={x}&y={y}&z={z}&styles=pl&scaler=1&p=1'},Satellite: {Map: 'http://shangetu{s}.map.bdimg.com/it/u=x={x};y={y};z={z};v=009;type=sate&fm=46',Annotion: 'http://online{s}.map.bdimg.com/tile/?qt=tile&x={x}&y={y}&z={z}&styles=sl&v=020'},Subdomains: '0123456789',tms: true}};L.tileLayer.chinaProvider = function(type, options) {return new L.TileLayer.ChinaProvider(type, options);
};
在HTML页面中引入leaflet.ChineseTmsProviders.js,加载多种瓦片地图
<!DOCTYPE html>
<html><head><meta http-equiv="Content-Type" content="text/html; charset=utf-8" /><title></title><!--leaflet样式文件--><link rel="stylesheet" href="https://unpkg.com/leaflet@1.7.1/dist/leaflet.css" /><!--leaflet核心JS文件--><script src="https://unpkg.com/leaflet@1.7.1/dist/leaflet.js"></script><!-- 引入 ChineseTmsProviders.js文件--><script src="./leaflet/leaflet.ChineseTmsProviders.js"></script><style>/*必须指定宽高度*/#map {width: 800px;height: 500px;}</style>
</head><body><div id="map"></div><script>// 天地图内容var TianDinormalm = L.tileLayer.chinaProvider('TianDiTu.Normal.Map', {maxZoom: 18,minZoom: 5});var TianDinormala = L.tileLayer.chinaProvider('TianDiTu.Normal.Annotion', {maxZoom: 18,minZoom: 5});var TianDiimgm = L.tileLayer.chinaProvider('TianDiTu.Satellite.Map', {maxZoom: 18,minZoom: 5});var TianDiimga = L.tileLayer.chinaProvider('TianDiTu.Satellite.Annotion', {maxZoom: 18,minZoom: 5});var TianDi = L.layerGroup([TianDinormalm, TianDinormala]);var TianDiImage = L.layerGroup([TianDiimgm, TianDiimga]);// 高德地图var Gaode = L.tileLayer.chinaProvider('GaoDe.Normal.Map', {maxZoom: 18,minZoom: 5});var Gaodeimgem = L.tileLayer.chinaProvider('GaoDe.Satellite.Map', {maxZoom: 18,minZoom: 5});var Gaodeimga = L.tileLayer.chinaProvider('GaoDe.Satellite.Annotion', {maxZoom: 18,minZoom: 5});var GaodeImage = L.layerGroup([Gaodeimgem, Gaodeimga]);// 谷歌地图var Google = L.tileLayer.chinaProvider('Google.Normal.Map', {maxZoom: 18,minZoom: 5})var Googleimgem = L.tileLayer.chinaProvider('Google.Satellite.Map', {maxZoom: 18,minZoom: 5});var Googleimga = L.tileLayer.chinaProvider('Google.Satellite.Annotion', {maxZoom: 18,minZoom: 5});var GoogleImage = L.layerGroup([Googleimgem, Googleimga]);// OSM地图var OSM = L.tileLayer.chinaProvider('OSM.Normal.Map', {maxZoom: 18,minZoom: 5});// 百度地图var Baidu = L.tileLayer.chinaProvider('Baidu.Normal.Map', {maxZoom: 18,minZoom: 5});var Baiduimgem = L.tileLayer.chinaProvider('Baidu.Satellite.Map', {maxZoom: 18,minZoom: 5});var Baiduimga = L.tileLayer.chinaProvider('Baidu.Satellite.Annotion', {maxZoom: 18,minZoom: 5});var BaiduImage = L.layerGroup([Baiduimgem, Baiduimga]);// 智图地图var normalm1 = L.tileLayer.chinaProvider('Geoq.Normal.Map', {maxZoom: 18,minZoom: 5});var normalm2 = L.tileLayer.chinaProvider('Geoq.Normal.Color', {maxZoom: 18,minZoom: 5});var normalm3 = L.tileLayer.chinaProvider('Geoq.Normal.PurplishBlue', {maxZoom: 18,minZoom: 5});var normalm4 = L.tileLayer.chinaProvider('Geoq.Normal.Gray', {maxZoom: 18,minZoom: 5});var normalm5 = L.tileLayer.chinaProvider('Geoq.Normal.Warm', {maxZoom: 18,minZoom: 5});var normalm6 = L.tileLayer.chinaProvider('Geoq.Normal.Cold', {maxZoom: 18,minZoom: 5});var baseLayers = {"天地图": TianDi,"天地图影像": TianDiImage,"高德地图": Gaode,"高德影像": GaodeImage,"谷歌地图": Google,"谷歌影像": GoogleImage,"OSM地图": OSM,"百度地图": Baidu,"百度影像": BaiduImage,"智图地图": normalm1,"智图多彩": normalm2,"智图午夜蓝": normalm3,"智图灰色": normalm4,"智图暖色": normalm5,"智图冷色": normalm6,}var map = L.map("map", {center: [23.127013, 113.366266],zoom: 8,layers: [Gaode], // 选择baseLayers的地图zoomControl: false,key: 'Your key', // 如果你使用天地图,请添加密钥key});L.control.layers(baseLayers, null).addTo(map);L.control.zoom({zoomInTitle: '放大',zoomOutTitle: '缩小'}).addTo(map);</script></body></html>
七、Leaflet地图小案例
【1】地图事件
<!DOCTYPE html>
<html><head><meta http-equiv="Content-Type" content="text/html; charset=utf-8" /><title></title><!--leaflet样式文件--><link rel="stylesheet" href="https://unpkg.com/leaflet@1.7.1/dist/leaflet.css" /><!--leaflet核心JS文件--><script src="https://unpkg.com/leaflet@1.7.1/dist/leaflet.js"></script><!-- 引入 ChineseTmsProviders.js文件--><script src="./leaflet/leaflet.ChineseTmsProviders.js"></script><style>/*必须指定宽高度*/#map {width: 800px;height: 500px;}</style>
</head><body><div id="map"></div><script>// 高德地图var Gaode = L.tileLayer.chinaProvider('GaoDe.Normal.Map', {maxZoom: 18,minZoom: 5});var map = L.map("map", {center: [23.127013, 113.366266],zoom: 8,layers: [Gaode],zoomControl: false,});//地图加载完成map.once("loadEnd", function () {console.log("地图加载完成");});//地图点击map.on("click", function (e) {console.log("你在地图" + e.latlng + "点击了");});//地图双击map.on("dblclick", function (e) {console.log("你在地图上双击了!");});//地图移动map.on("move", function (e) {console.log("地图移动了");});//地图层级改变map.on("zoom", function (e) {console.log("地图层级改变了");});</script></body></html>
【2】 中心点和层级显示
<!DOCTYPE html>
<html><head><meta http-equiv="Content-Type" content="text/html; charset=utf-8" /><title></title><!--leaflet样式文件--><link rel="stylesheet" href="https://unpkg.com/leaflet@1.7.1/dist/leaflet.css" /><!--leaflet核心JS文件--><script src="https://unpkg.com/leaflet@1.7.1/dist/leaflet.js"></script><!-- 引入 ChineseTmsProviders.js文件--><script src="./leaflet/leaflet.ChineseTmsProviders.js"></script><style>/*必须指定宽高度*/#map {width: 800px;height: 500px;}.info {padding: 10px;background-color: #fff;border-radius: 4px;}</style>
</head><body><div id="map"></div><script>// 高德地图var Gaode = L.tileLayer.chinaProvider('GaoDe.Normal.Map', {maxZoom: 18,minZoom: 5});var map = L.map("map", {center: [23.127013, 113.366266],zoom: 8,layers: [Gaode],zoomControl: true,});// 设置地图中心点与缩放级别map.setView([23.165103, 113.405802], 15);// 自定义info控件var info = L.control();info.onAdd = function (map) {this.infoDiv = L.DomUtil.create("div", "info"); // 创建一个class为info的divthis.update(map.getZoom(), map.getCenter()); // map.getZoom()获取地图当前层级  map.getCenter()获取地图当前中心点return this.infoDiv;};//根据当前地图状态更新显示信息info.update = function (zoom, center) {this.infoDiv.innerHTML ="<b>当前地图状态</b><br/>" +"<b>zoom: </b>" + zoom + "<br/>" +"<b>center: </b>" + center + "";};info.addTo(map);//监听地图状态变化map.on("move", moveMap);function moveMap(e) {info.update(map.getZoom(), map.getCenter());}</script></body></html>
【3】 获取和设置地图可视范围
<!DOCTYPE html>
<html><head><meta http-equiv="Content-Type" content="text/html; charset=utf-8" /><title></title><!--leaflet样式文件--><link rel="stylesheet" href="https://unpkg.com/leaflet@1.7.1/dist/leaflet.css" /><!--leaflet核心JS文件--><script src="https://unpkg.com/leaflet@1.7.1/dist/leaflet.js"></script><!-- 引入 ChineseTmsProviders.js文件--><script src="./leaflet/leaflet.ChineseTmsProviders.js"></script><style>/*必须指定宽高度*/#map {width: 800px;height: 500px;}.info {padding: 10px;background-color: #fff;border-radius: 4px;}</style>
</head><body><div id="map"></div><script>// 高德地图var Gaode = L.tileLayer.chinaProvider('GaoDe.Normal.Map', {maxZoom: 18,minZoom: 5});var map = L.map("map", {center: [23.127013, 113.366266],zoom: 8,layers: [Gaode],zoomControl: true,});// 设置地图当前显示范围有两种方法:一是用fitBounds(bounds),二是flyToBounds(bounds),// 区别在于后者有飞行动画效果,前者没有;// 其中bounds参数可以上一个LatLngBounds对象,也可以是一个包含矩形对角点的数组。// LatLngBounds对象var corner1 = L.latLng(30, 106);var corner2 = L.latLng(28.9, 105.51);var bounds = L.latLngBounds(corner1, corner2);// 第一种 fitBounds(bounds) 没有飞行效果//map.fitBounds(bounds)// 第二种 flyToBounds(bounds)有飞行效果map.flyToBounds(bounds);// 包含矩形对角点的数组// map.fitBounds([//   [30, 106],//   [28.9, 105.51]// ]);// 自定义info控件var info = L.control();info.onAdd = function (map) {this.infoDiv = L.DomUtil.create("div", "info"); // 创建一个class为info的divthis.update(map.getBounds()); // map.getBounds()获取地图可视范围return this.infoDiv;};//根据当前地图状态更新显示信息info.update = function (bounds) {this.infoDiv.innerHTML ="<b>当前地图显示范围</b><br/>" +"<b>右上角: </b>" + bounds.getNorthEast() + "<br/>" +"<b>左下角: </b>" + bounds.getSouthWest() + "";};info.addTo(map);//监听地图状态变化map.on("move", moveMap);function moveMap(e) {info.update(map.getBounds());}</script></body></html>
【4】 mark的使用
<!DOCTYPE html>
<html><head><meta http-equiv="Content-Type" content="text/html; charset=utf-8" /><title></title><!--leaflet样式文件--><link rel="stylesheet" href="https://unpkg.com/leaflet@1.7.1/dist/leaflet.css" /><!--leaflet核心JS文件--><script src="https://unpkg.com/leaflet@1.7.1/dist/leaflet.js"></script><!-- 引入 ChineseTmsProviders.js文件--><script src="./leaflet/leaflet.ChineseTmsProviders.js"></script><style>/*必须指定宽高度*/#map {width: 800px;height: 500px;}</style>
</head><body><div id="map"></div><script>// 高德地图var Gaode = L.tileLayer.chinaProvider('GaoDe.Normal.Map', {maxZoom: 18,minZoom: 5});var map = L.map("map", {center: [23.127013, 113.366266],zoom: 8,layers: [Gaode],zoomControl: true,});// 添加markermarker = L.marker([23.127013, 113.366266], {draggable: true,autoPan: false});// marker添加到地图上marker.addTo(map);// marker绑定气泡marker.bindPopup("我是一个图标");// marker绑定事件,当拖动完成时触发marker.on('dragend', function () {console.log('图标移动完成');});</script></body></html>
【5】 mark自定义icon图片
<!DOCTYPE html>
<html><head><meta http-equiv="Content-Type" content="text/html; charset=utf-8" /><title></title><!--leaflet样式文件--><link rel="stylesheet" href="https://unpkg.com/leaflet@1.7.1/dist/leaflet.css" /><!--leaflet核心JS文件--><script src="https://unpkg.com/leaflet@1.7.1/dist/leaflet.js"></script><!-- 引入 ChineseTmsProviders.js文件--><script src="./leaflet/leaflet.ChineseTmsProviders.js"></script><style>/*必须指定宽高度*/#map {width: 800px;height: 500px;}</style>
</head><body><div id="map"></div><script>// 高德地图var Gaode = L.tileLayer.chinaProvider('GaoDe.Normal.Map', {maxZoom: 18,minZoom: 5});var map = L.map("map", {center: [23.127013, 113.366266],zoom: 8,layers: [Gaode],zoomControl: true,});// 自定义图标var customIcon = L.icon({iconUrl: './images/like.svg',iconSize: [55, 55]});// 添加marker,并设置图标marker = L.marker([23.167561, 113.400282], {draggable: true,autoPan: false,icon: customIcon}).addTo(map);// marker绑定气泡marker.bindPopup("我是一个图标");// marker绑定事件,当拖动完成时触发marker.on('dragend', function () {console.log('图标移动完成');});</script></body></html>
【6】tooltip的使用
<!DOCTYPE html>
<html><head><meta http-equiv="Content-Type" content="text/html; charset=utf-8" /><title></title><!--leaflet样式文件--><link rel="stylesheet" href="https://unpkg.com/leaflet@1.7.1/dist/leaflet.css" /><!--leaflet核心JS文件--><script src="https://unpkg.com/leaflet@1.7.1/dist/leaflet.js"></script><!-- 引入 ChineseTmsProviders.js文件--><script src="./leaflet/leaflet.ChineseTmsProviders.js"></script><style>/*必须指定宽高度*/#map {width: 800px;height: 500px;}</style>
</head><body><div id="map"></div><script>// 高德地图var Gaode = L.tileLayer.chinaProvider('GaoDe.Normal.Map', {maxZoom: 18,minZoom: 5});var map = L.map("map", {center: [23.127013, 113.366266],zoom: 8,layers: [Gaode],zoomControl: true,});// 添加markermarker = L.marker([23.127013, 113.366266], {draggable: true,autoPan: false,}).addTo(map);// tooltip与marker绑定var t = marker.bindTooltip("my tooltip text").openTooltip();// 实现动态修改内容t.setTooltipContent('<p>动态修改与mark绑定的ToolTip~ </p>')// 实现单独叠加L.tooltip().setLatLng([23.129013, 114.366266]).setContent('<p>单独叠加的ToolTip</p>').addTo(map);</script></body></html>
【7】popup的使用
<!DOCTYPE html>
<html><head><meta http-equiv="Content-Type" content="text/html; charset=utf-8" /><title></title><!--leaflet样式文件--><link rel="stylesheet" href="https://unpkg.com/leaflet@1.7.1/dist/leaflet.css" /><!--leaflet核心JS文件--><script src="https://unpkg.com/leaflet@1.7.1/dist/leaflet.js"></script><!-- 引入 ChineseTmsProviders.js文件--><script src="./leaflet/leaflet.ChineseTmsProviders.js"></script><style>/*必须指定宽高度*/#map {width: 800px;height: 500px;}</style>
</head><body><div id="map"></div><script>// 高德地图var Gaode = L.tileLayer.chinaProvider('GaoDe.Normal.Map', {maxZoom: 18,minZoom: 5});var map = L.map("map", {center: [23.127013, 113.366266],zoom: 8,layers: [Gaode],zoomControl: true,});// 添加markermarker = L.marker([23.127013, 113.366266], {draggable: true,autoPan: false,}).addTo(map);// popup与marker绑定var t = marker.bindPopup("my popup text")// 实现动态修改内容t.setPopupContent('<p>动态修改与mark绑定的popup~ </p>')// 实现单独叠加L.popup().setLatLng([23.129013, 114.366266]).setContent('<p>单独叠加的popup</p>').openOn(map);</script></body></html>
【8】 线的显示
<!DOCTYPE html>
<html><head><meta http-equiv="Content-Type" content="text/html; charset=utf-8" /><title></title><!--leaflet样式文件--><link rel="stylesheet" href="https://unpkg.com/leaflet@1.7.1/dist/leaflet.css" /><!--leaflet核心JS文件--><script src="https://unpkg.com/leaflet@1.7.1/dist/leaflet.js"></script><!-- 引入 ChineseTmsProviders.js文件--><script src="./leaflet/leaflet.ChineseTmsProviders.js"></script><style>/*必须指定宽高度*/#map {width: 800px;height: 500px;}</style>
</head><body><div id="map"></div><script>// 高德地图var Gaode = L.tileLayer.chinaProvider('GaoDe.Normal.Map', {maxZoom: 18,minZoom: 5});var map = L.map("map", {center: [23.127013, 113.366266],zoom: 8,layers: [Gaode],zoomControl: true,});// 从一组坐标点创建红色的线var latlngs = [[45.51, -122.68],[37.77, -122.43],[34.04, -118.2]];var polyline = L.polyline(latlngs, {color: 'red',weight: 8,dashArray: "5,10,20"}).addTo(map);// click操作polyline.on('click', function () {console.log('点了线一下')});// 地图显示区域为红线所在位置map.flyToBounds(polyline.getBounds());</script></body></html>
【9】 缩放组件和自定义缩放组件
<!DOCTYPE html>
<html><head><meta http-equiv="Content-Type" content="text/html; charset=utf-8" /><title></title><!--leaflet样式文件--><link rel="stylesheet" href="https://unpkg.com/leaflet@1.7.1/dist/leaflet.css" /><!--leaflet核心JS文件--><script src="https://unpkg.com/leaflet@1.7.1/dist/leaflet.js"></script><!-- 引入 ChineseTmsProviders.js文件--><script src="./leaflet/leaflet.ChineseTmsProviders.js"></script><style>/*必须指定宽高度*/#map {width: 800px;height: 500px;}</style>
</head><body><div id="map"></div><script>// 高德地图var Gaode = L.tileLayer.chinaProvider('GaoDe.Normal.Map', {maxZoom: 18,minZoom: 5});var map = L.map("map", {center: [23.127013, 113.366266],zoom: 8,layers: [Gaode],zoomControl: false,});//创建内置缩放组件,将其置于地图的右上角L.control.zoom({zoomInText: "?",zoomOutText: "?",position: "topright"}).addTo(map);//自定义缩放按钮var customZoom = L.control();customZoom.onAdd = function (map) {this._container = L.DomUtil.create("div"); // 创建一个放按钮的div// 缩小this._btn_zoom_out = L.DomUtil.create("input","example-button",this._container);this._btn_zoom_out.type = "button";this._btn_zoom_out.value = "缩小";// 使用DomEvent绑定事件L.DomEvent.on(this._btn_zoom_out, "click", function (e) {if (map._zoom < map.getMaxZoom()) {map.zoomOut(map.options.zoomDelta * (e.shiftKey ? 3 : 1));}});// 放大this._btn_zoom_in = L.DomUtil.create("input","example-button",this._container);this._btn_zoom_in.type = "button";this._btn_zoom_in.value = "放大";// 使用DomEvent绑定事件L.DomEvent.on(this._btn_zoom_in, "click", function (e) {if (map._zoom < map.getMaxZoom()) {map.zoomIn(map.options.zoomDelta * (e.shiftKey ? 3 : 1));}});return this._container;};customZoom.addTo(map);</script></body></html>