前言
上一篇 leaflet:入门基础(二) 讲了如何加载底图
这一篇将讲解如何加载自己已有的数据
1:加载Geojson数据
注:如果手上有shp数据,可以通过https://mapshaper.org/转换得到geojson数据(使用说明[链接])
var map = new L.Map('map', {center: new L.LatLng(39.86,116.45),zoom: 10});var baseLayers = L.tileLayer('http://{s}.tile.openstreetmap.org/{z}/{x}/{y}.png', {maxZoom: 18}).addTo(map);var geoJSON = { // 填入此处 };var layerGeo = L.geoJSON(geoJSON, {}).addTo(map);
如果对数据渲染样式有要求也可以进行修改
var myStyle = {"color": "green","weight": 3,"opacity": 0.5,};var layerGeo = L.geoJSON( geoJSON, { style:myStyle }).addTo(map);

2:加载矢量切片
安装 geoserver [链接],此时geoserver最新版本为 2.17.1,但并没有找到以Windows安装程序下载,而在 2.15.1 找到了可执行程序版[链接]。GeoServer项目丢失了用于构建安装程序的Windows构建服务器,所以 2.15.1 是目前最后一个拥有windows installer的版本,为了避免与Tomcat端口号冲突要修改GeoServer的端口号 [链接]。
同时还要下载一个同版本的 geoserver-2.15.1-vectortiles-plugin.zip, 如果用的是windows installer,则插件解压出来放入geoserver安装目录\webapps\geoserver\WEB-INF\lib;如果用的是war,则放入tomcat安装目录/geoserver/WEB-INF/lib

geoserver 发布矢量切片 [链接] 。 我用了一个广州天河区路网 坐标系 EPSG:900913
遇到的问题:发布好后,用 leaflet 调用却没有显示,花了两天才找到问题。详见另一篇文章 [点击跳转]
导入其它需要的js文件
<script src="https://unpkg.com/leaflet.vectorgrid@latest/dist/Leaflet.VectorGrid.bundled.js"></script>
<script src="https://unpkg.com/leaflet.vectorgrid@latest/dist/Leaflet.VectorGrid.js"></script>
加载底图
var map = new L.Map('map', {center: new L.LatLng(23.16,113.35),zoom: 12,crs: L.CRS.EPSG900913});var baseLayers = L.tileLayer('https://{s}.basemaps.cartocdn.com/light_all/{z}/{x}/{y}.png', {maxZoom: 20 }).addTo(map);
获得 geoserver 发布的数据地址,加载矢量切片
var url = "http://localhost:8081/geoserver/gwc/service/tms/1.0.0/cite%3Atianhe@EPSG%3A900913@pbf/{z}/{x}/{-y}.pbf";var vectorTileOptions = {layerURL: url,rendererFactory: L.canvas.tile,           tms: true, // 如果是 TMS 方式,则必须开启
}; var vectorTile = new L.vectorGrid.protobuf(url, vectorTileOptions).addTo(map);

还可以设置显示样式,比如这里我希望把 车陂路 凸显出来
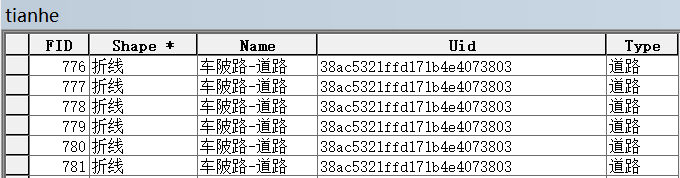
var vectorTileOptions = {'...', // 与上面一致,这里不重复写了vectorTileLayerStyles: {      'tianhe': function (properties, zoom) { // tianhe 为切片图层名称          var name = properties.Name; // 获取图层的 Name 属性if( name == "车陂路-道路"){return {            weight: 5,            color: 'red',       }      }else{return {            weight: 1,            color: 'green',       }      }}    },
};

还可以添加一个鼠标事件
var vectorTileOptions = {'...', // 与上面一致,这里不重复写了interactive: true,	//开启VectorGrid触发mouse/pointer事件
}; vectorTile.on('mouseover', function (e) {    var properties = e.layer.properties;    L.popup().setContent(properties.Name).setLatLng(e.latlng).openOn(map);  }
);
