字体相关:
统一改变所有字体大小、样式等:
import matplotlib
import matplotlib.pyplot as pltmatplotlib.rcParams.update({'font.size':22, 'font.family':'Times New Roman'})
单独设置字体:
font1 = {'family' : 'Times New Roman','size' : 25,} # 设置样式plt.xlabel("epoch", font1) # 应用显示图例(legend) :
plt.plot(loss1, label='LSTM(32)') # 先命名曲线plt.legend() # 再显示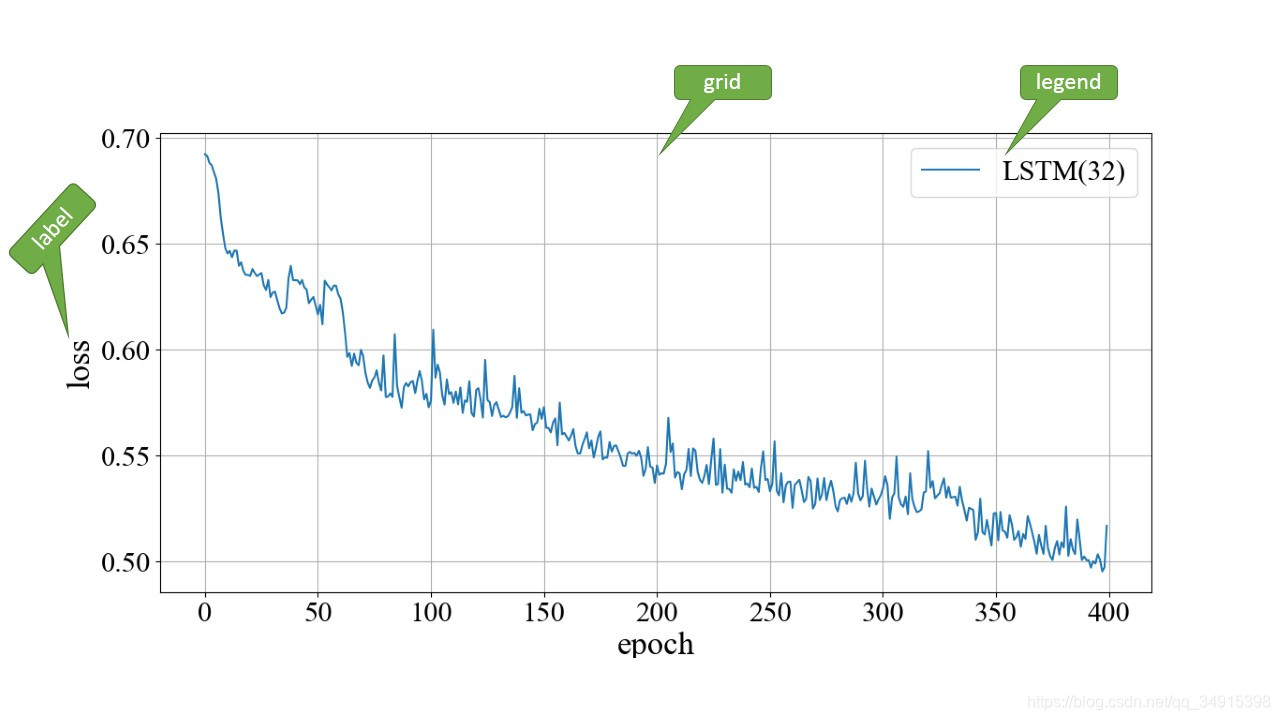
颜色设置:
1. 简单颜色表示
plt.plot(x, y, color='black')2. 十六进制颜色表示
plt.plot(x, y, color='#0f0f0f')3. RGB 表示
此时注意要将R,G,B每个值除以255,使其属于0~1之间,如下为红色
plt.plot(a, b, color=(1, 0, 0))同理,白色为(1,1,1)